Background
With the long term goal of providing the end user with an overall control of her economy, the first step was to create an easy way of getting a quick overview of all monthly expenses. This would also include the ability to categorise and re-categorise expenses.
Wireframes
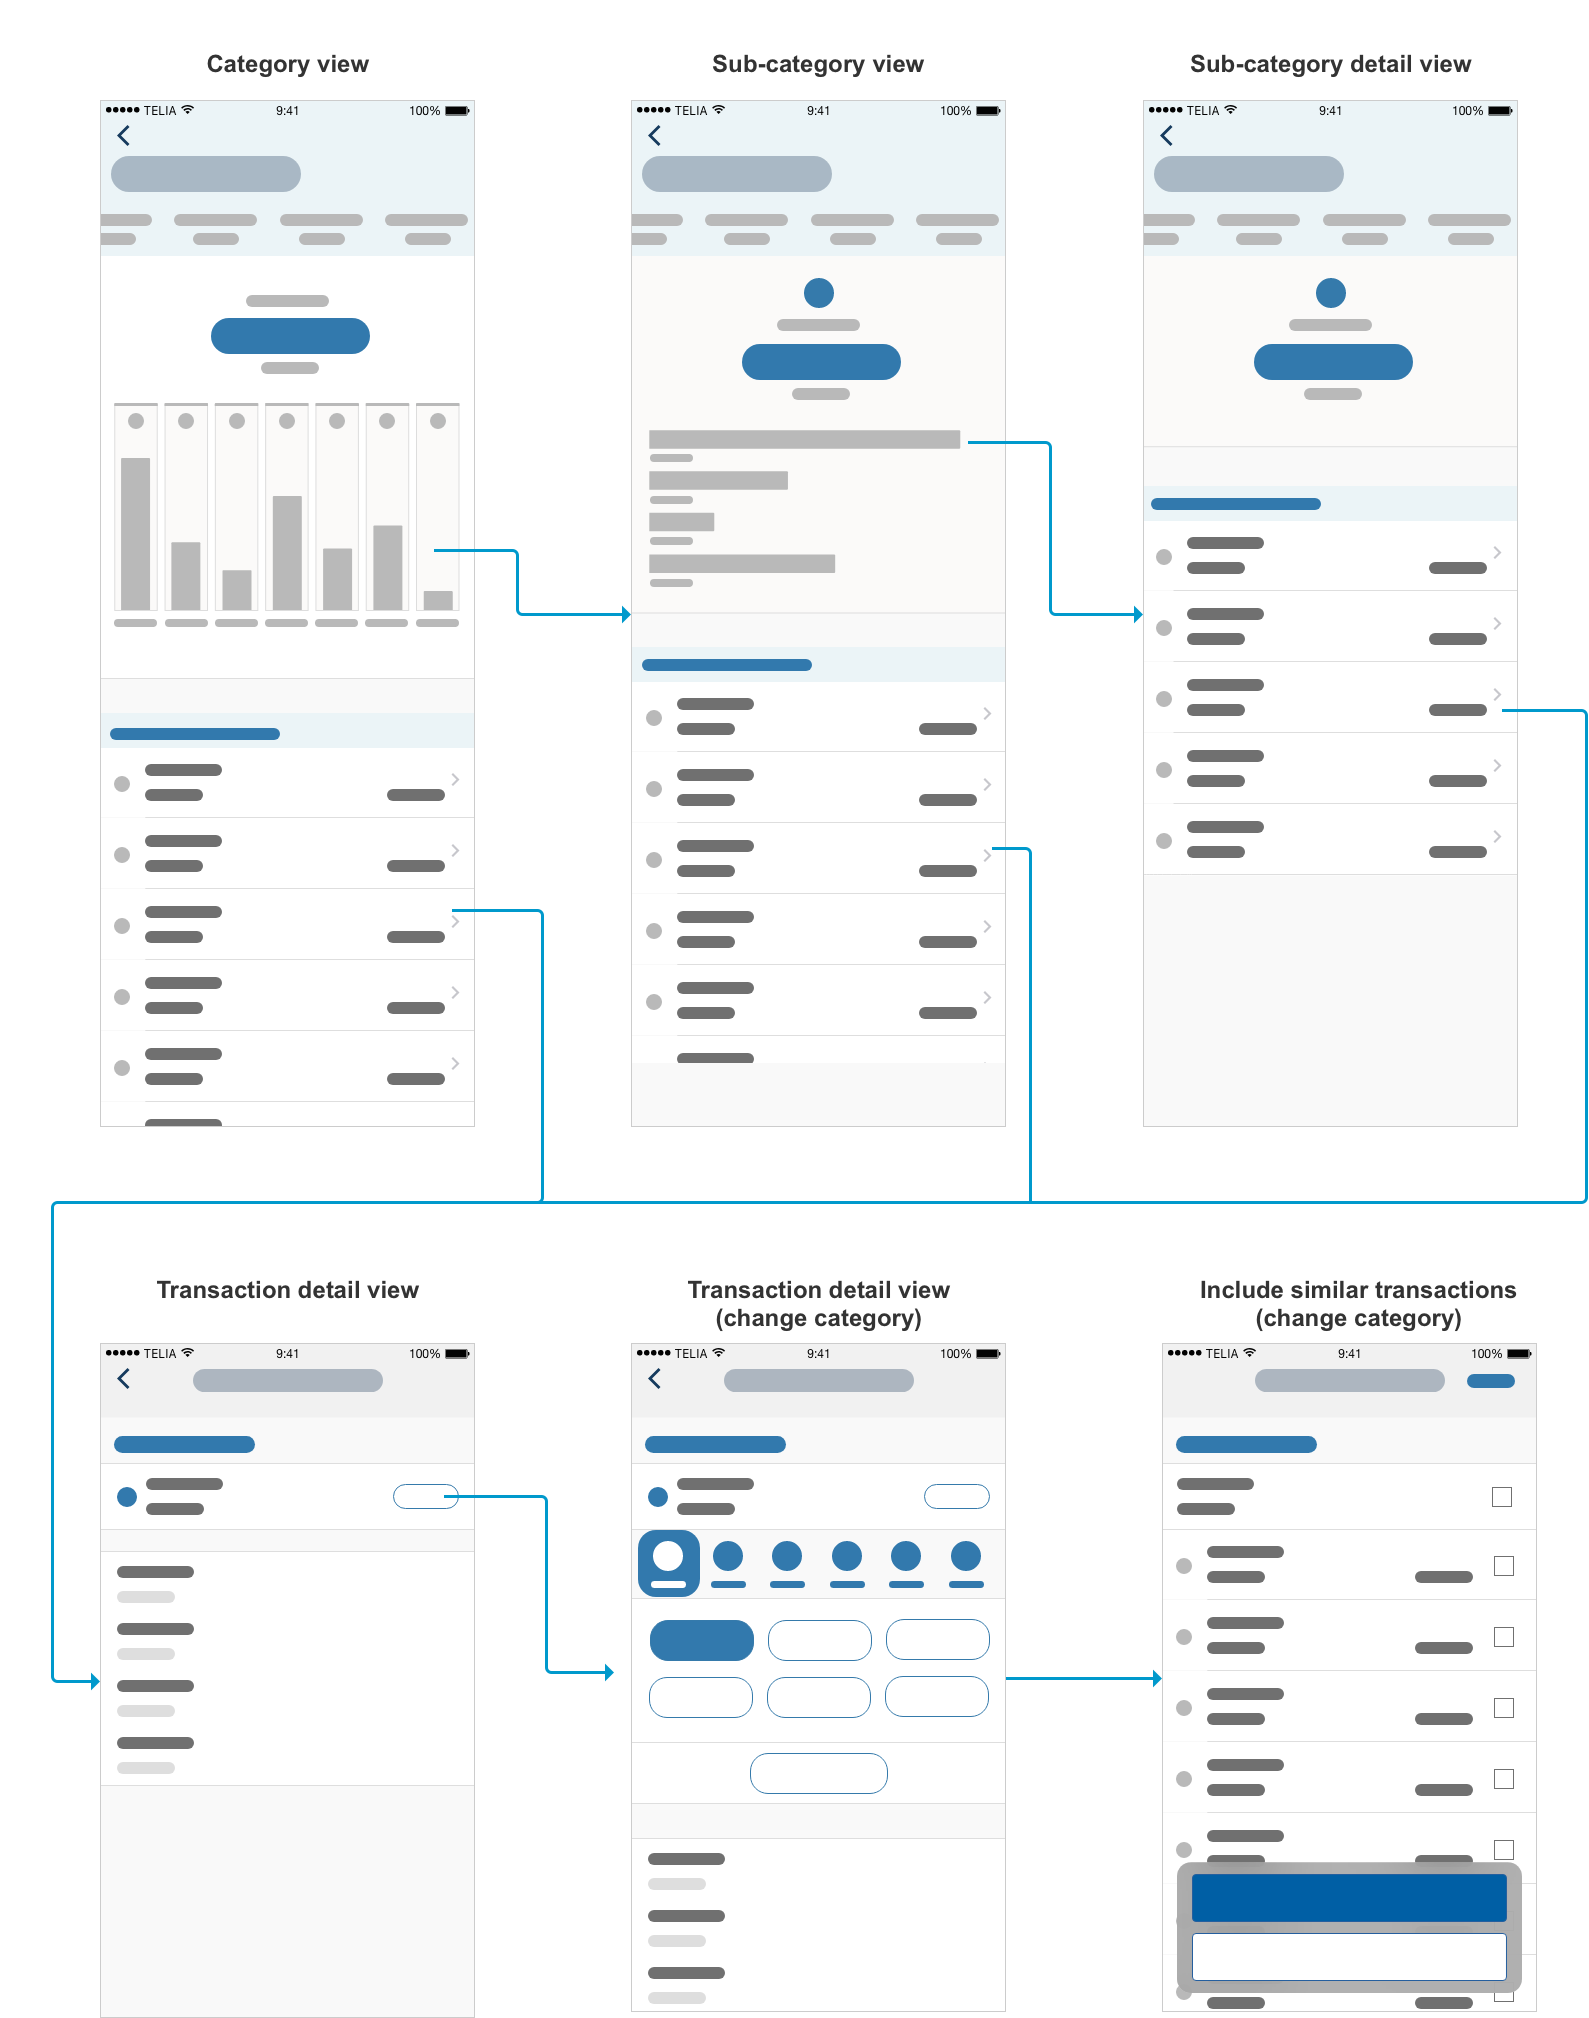
The PFM uses a three level hierarchy where each level present a more detailed view of the users expenses. The first view (category view) display a sum of the users total expenses as well as graph illustrating how these expenses are distributed over the main categories. Below the graph is a chronological list of the transactions for the current month. The second view (sub-category view) is displayed when the user click a category bar from the graph in the category view. Like the Category view the Sub-category view display a sum of the users total expenses but only for the particular main category. The view also contain a graph but uses a horisontal bars the vertical bars used in the Category view. A subset of the transactions are displayed in a list below the graph.
Clicking one of the bars in the Sub-category graph takes the user to the Sub-category detail view. This view display a sum for the sub category as well as the subset of transactions categorised with that sub-category.

Clicking a transaction in either of the views will open the transaction detail view. In this view the user can see details for a specific transaction as well as change the category. The user then have the option to change only the specific transaction or include similar transactions, both past and future.
Prototype


